Composite Trend Oscillator [ChartPrime]CODE DUELLO:
Have you ever stopped to wonder what the underlying filters contained within complex algorithms are actually providing for you? Wouldn't it be nice to actually visually inspect for that? Those would require some kind of wild west styled quick draw duel or some comparison method as a proper 'code duello'. Then it can be determined which filter can 'draw' the quickest from it's computational holster with the least amount of lag and smoothness.
In Pine we can do so, discovering how beneficial that would be. This can be accomplished by quickly switching from one filter to another by input() back and forth, requiring visual memory. A better way could be done by placing two indicators added to the chart and then eventually placed into one indicator pane on top of each other.
By adding a filter() helper function that calls other moving average functions chosen for comparison, it can put to the test which moving average is the best drawing filter suited to our expected needs. PhiSmoother was formerly debuted and now it is utilized in a more complex environment in a multitude of ways along side other commonly utilized filters. Now, you the reader, get to judge for yourself...
FILTER VERSATILITY:
Having the capability to adjust between various smoothing methods such as PhiSmoother, TEMA, DEMA, WMA, EMA, and SMA on historical market data within the code provides an advantage. Each of these filter methods offers distinct advantages and hinderances. PhiSmoother stands out often by having superb noise rejection, while also being able to manipulate the fine-tuning of the phase or lag of the indicator, enhancing responsiveness to price movements.
The following are more well-known classic filters. TEMA (Triple Exponential Moving Average) and DEMA (Double Exponential Moving Average) offer reduced transient response times to price changes fluctuations. WMA (Weighted Moving Average) assigns more weight to recent data points, making it particularly useful for reduced lag. EMA (Exponential Moving Average) strikes a balance between responsiveness and computational efficiency, making it a popular choice. SMA (Simple Moving Average) provides a straightforward calculation based on the arithmetic mean of the data. VWMA and RMA have both been excluded for varying reasons, both being unworthy of having explanation here.
By allowing for adjustment refinements between these filter methods, traders may garner the flexibility to adapt their analysis to different market dynamics, optimizing their algorithms for improved decision-making and performance on demand.
INDICATOR INTRODUCTION:
ChartPrime's Composite Trend Oscillator operates as an oscillator based on the concept of a moving average ribbon. It utilizes up to 32 filters with progressively longer periods to assess trend direction and strength. Embedded within this indicator is an alternative view that utilizes the separation of the ribbon filaments to assess volatility. Both versions are excellent candidates for trend and momentum, both offering visualization of polarity, directional coloring, and filter crossings. Anyone who has former experience using RSI or stochastics may have ease of understanding applying this to their chart.
COMPOSITE CLUSTER MODES EXPLAINED:
In Trend Strength mode, the oscillator behavior signifies market direction and movement strength. When the oscillator is rising and above zero, the market is within a bullish phase, and visa versa. If the signal filter crosses the composite trend, this indicates a potential dynamic shift signaling a possible reversal. When the oscillator is teetering on its extremities, the market is more inclined to reverse later.
With Volatility mode, the oscillator undergoes a transformation, displaying an unbounded oscillator driven by market volatility. While it still employs the same scoring mechanism, it is now scaled according to the strength of the market move. This can aid with identification of ranging scenarios. However, one side effect is that the oscillator no longer has minimum or maximum boundaries. This can still be advantageous when considering divergences.
NOTEWORTHY SETTINGS FEATURES:
The following input settings described offer comprehensive control over the indicator's behavior and visualization.
Common Controls:
Price Source Selection - The indicator offers flexibility in choosing the price source for analysis. Traders can select from multiple options.
Composite Cluster Mode - Choose between "Trend Strength" and "Volatility" modes, providing insights into trend directionality or volatility weighting.
Cluster Filter and Length - Selects a filter for the cluster composition. This includes a length parameter adjustment.
Cluster Options:
Cluster Dispersion - Users can adjust the separation between moving averages in the cluster, influencing the sensitivity of the analysis.
Cluster Trimming - By modifying upper and lower trim parameters, traders can adjust the sensitivity of the moving averages within the cluster, enhancing its adaptability.
PostSmooth Filter and Length - Choose a filter to refine the composite cluster's post-smoothing with a length parameter adjustment.
Signal Filter and Length - Users can select a filter for the lagging signal plot, also having a length parameter adjustment.
Transition Easing - Sensitivity adjustment to influence the transition between bullish and bearish colors.
Enjoy
Cerca negli script per "Exponential Moving Average"

Long EMA Strategy with Advanced Exit OptionsThis strategy is designed for traders seeking a trend-following system with a focus on precision and adaptability.
**Core Strategy Concept**
The essence of this strategy lies in use of Exponential Moving Averages (EMAs) to identify potential long (buy) positions based on the relative positions of short-term, medium-term, and long-term EMAs. The use of EMAs is a classic yet powerful approach to trend detection, as these indicators smooth out price data over time, emphasizing the direction of recent price movements and potentially signaling the beginning of new trends.
**Customizable Parameters**
- **EMA Periods**: Users can define the periods for three EMAs - long-term, medium-term, and short-term - allowing for a tailored approach to capture trends based on individual trading styles and market conditions.
- **Volatility Filter**: An optional Average True Range (ATR)-based volatility filter can be toggled on or off. When activated, it ensures that trades are only entered when market volatility exceeds a user-defined threshold, aiming to filter out entries during low-volatility periods which are often characterized by indecisive market movements.
- **Trailing Stop Loss**: A trailing stop loss mechanism, expressed as a percentage of the highest price achieved since entry, provides a dynamic way to manage risk by allowing profits to run while cutting losses.
- **EMA Exit Condition**: This advanced exit option enables closing positions when the short-term EMA crosses below the medium-term EMA, serving as a signal that the immediate trend may be reversing.
- **Close Below EMA Exit**: An additional exit condition, which is disabled by default, allows positions to be closed if the price closes below a user-selected EMA. This provides an extra layer of flexibility and risk management, catering to traders who prefer to exit positions based on specific EMA thresholds.
**Operational Mechanics**
Upon activation, the strategy evaluates the current price in relation to the set EMAs. A long position is considered when the current price is above the long-term EMA, and the short-term EMA is above the medium-term EMA. This setup aims to identify moments where the price momentum is strong and likely to continue.
The strategy's versatility is further enhanced by its optional settings:
- The **Volatility Filter** adjusts the sensitivity of the strategy to market movements, potentially improving the quality of the entries during volatile market conditions.
The Average True Range (ATR) is a key component of this filter, providing a measure of market volatility by calculating the average range between the high and low prices over a specified number of periods. Here's how you can adjust the volatility filter settings for various market conditions, focusing on filtering out low-volatility markets:
Setting Examples for Volatility Filter
1. High Volatility Markets (e.g., Cryptocurrencies, Certain Forex Pairs):
ATR Periods: 14 (default)
ATR Multiplier: Setting the multiplier to a lower value, such as 1.0 or 1.2, can be beneficial in high-volatility markets. This sensitivity allows the strategy to react to volatility changes more quickly, ensuring that you're entering trades during periods of significant movement.
2. Medium Volatility Markets (e.g., Major Equity Indices, Medium-Volatility Forex Pairs):
ATR Periods: 14 (default)
ATR Multiplier: A multiplier of 1.5 (default) is often suitable for medium volatility markets. It provides a balanced approach, ensuring that the strategy filters out low-volatility conditions without being overly restrictive.
3. Low Volatility Markets (e.g., Some Commodities, Low-Volatility Forex Pairs):
ATR Periods: Increasing the ATR period to 20 or 25 can smooth out the volatility measure, making it less sensitive to short-term fluctuations. This adjustment helps in focusing on more significant trends in inherently stable markets.
ATR Multiplier: Raising the multiplier to 2.0 or even 2.5 increases the threshold for volatility, effectively filtering out low-volatility conditions. This setting ensures that the strategy only triggers trades during periods of relatively higher volatility, which are more likely to result in significant price movements.
How to Use the Volatility Filter for Low-Volatility Markets
For traders specifically interested in filtering out low-volatility markets, the key is to adjust the ATR Multiplier to a higher level. This adjustment increases the threshold required for the market to be considered sufficiently volatile for trade entries. Here's a step-by-step guide:
Adjust the ATR Multiplier: Increase the ATR Multiplier to create a higher volatility threshold. A multiplier of 2.0 to 2.5 is a good starting point for very low-volatility markets.
Fine-Tune the ATR Periods: Consider lengthening the ATR calculation period if you find that the strategy is still entering trades in undesirable low-volatility conditions. A longer period provides a more averaged-out measure of volatility, which might better suit your needs.
Monitor and Adjust: Volatility is not static, and market conditions can change. Regularly review the performance of your strategy in the context of current market volatility and adjust the settings as necessary.
Backtest in Different Conditions: Before applying the strategy live, backtest it across different market conditions with your adjusted settings. This process helps ensure that your approach to filtering low-volatility conditions aligns with your trading objectives and risk tolerance.
By fine-tuning the volatility filter settings according to the specific characteristics of the market you're trading in, you can enhance the performance of this strategy
- The **Trailing Stop Loss** and **EMA Exit Conditions** provide two layers of exit strategies, focusing on capital preservation and profit maximization.
**Visualizations**
For clarity and ease of use, the strategy plots the three EMAs and, if enabled, the ATR threshold on the chart. These visual cues not only aid in decision-making but also help in understanding the market's current trend and volatility state.
**How to Use**
Traders can customize the EMA periods to fit their trading horizon, be it short, medium, or long-term trading. The volatility filter and exit options allow for further customization, making the strategy adaptable to different market conditions and personal risk tolerance levels.
By offering a blend of trend-following principles with advanced risk management features, this strategy aims to cater to a wide range of trading styles, from cautious to aggressive. Its strength lies in its flexibility, allowing traders to fine-tune settings to their specific needs, making it a potentially valuable tool in the arsenal of any trader looking for a disciplined approach to navigating the markets.

EMA Envelope - Signal with Stoploss and Takeprofit LevelsDescription:
This Pine Script indicator implements the EMA Envelope strategy, which utilizes Exponential Moving Averages (EMA) to create an envelope around the price chart. The strategy generates buy and sell signals based on the crossing of the price above and below the upper and lower EMA envelopes, respectively. It also incorporates additional features such as stop-loss and take-profit levels for risk management.
Indicator Settings:
EMA Length: Specifies the period for the short-term Exponential Moving Average.
Long Term EMA Length: Defines the period for the long-term Exponential Moving Average used for signal filtering.
Take Profit Ratio: Determines the ratio for calculating the take-profit levels based on the stop-loss.
Filter Signal on Long Term EMA: Enables or disables the filtering of buy/sell signals using the long-term EMA.
Show only recent signal: When enabled, shows only the most recent buy/sell signals.
Buy and Sell Signals:
The indicator generates buy signals when the price crosses above the upper EMA envelope and the previous low was below the upper EMA envelope. Additionally, you can choose to filter buy signals based on whether the closing price is above the long-term EMA.
Conversely, sell signals are generated when the price crosses below the lower EMA envelope, and the previous high was above the lower EMA envelope. Similar to buy signals, sell signals can also be filtered using the long-term EMA.
Note: Signal works well on Higher Timeframes like Daily/8hrs/4hrs/1hr.
Stop-Loss and Take-Profit Levels:
For buy signals, the stop-loss is set at the lower EMA level, while the take-profit level is calculated by adding a specified ratio of the difference between the low and the stop-loss level to the low price.
For sell signals, the stop-loss is set at the upper EMA level, and the take-profit level is calculated by subtracting a specified ratio of the difference between the stop-loss level and the high price from the high price.
Disclaimer:
This indicator is provided for educational and informational purposes only. Trading involves significant risk, and past performance does not guarantee future results. Users are solely responsible for their trading decisions and should conduct their own research and risk management. The author shall not be held liable for any losses or damages arising from the use of this indicator.
Note: Always test the indicator thoroughly on historical data and consider paper trading before applying it to live trading environments.

Regularized-Moving-Average Oscillator SuiteThe Regularized-MA Oscillator Suite is a versatile indicator that transforms any moving average into an oscillator. It comprises up to 13 different moving average types, including KAMA, T3, and ALMA. This indicator serves as a valuable tool for both trend following and mean reversion strategies, providing traders and investors with enhanced insights into market dynamics.
Methodology:
The Regularized MA Oscillator Suite calculates the moving average (MA) based on user-defined parameters such as length, moving average type, and custom smoothing factors. It then derives the mean and standard deviation of the MA using a normalized period. Finally, it computes the Z-Score by subtracting the mean from the MA and dividing it by the standard deviation.
KAMA (Kaufman's Adaptive Moving Average):
KAMA is a unique moving average type that dynamically adjusts its smoothing period based on market volatility. It adapts to changing market conditions, providing a smoother response during periods of low volatility and a quicker response during periods of high volatility. This allows traders to capture trends effectively while reducing noise.
T3 (Tillson's Exponential Moving Average):
T3 is an exponential moving average that incorporates additional smoothing techniques to reduce lag and provide a more responsive indicator. It aims to maintain a balance between responsiveness and smoothness, allowing traders to identify trend reversals with greater accuracy.
ALMA (Arnaud Legoux Moving Average):
ALMA is a moving average type that utilizes a combination of linear regression and exponential moving average techniques. It offers a unique way of calculating the moving average by providing a smoother and more accurate representation of price trends. ALMA reduces lag and noise, enabling traders to identify trend changes and potential entry or exit points more effectively.
Z-Score:
The Z-Score calculation in the Regularized-MA Oscillator Suite standardizes the values of the moving average. It measures the deviation of each data point from the mean in terms of standard deviations. By normalizing the moving average through the Z-Score, the indicator enables traders to assess the relative position of price in relation to its mean and volatility. This information can be valuable for identifying overbought and oversold conditions, as well as potential trend reversals.
Utility:
The Regularized-MA Oscillator Suite with its unique moving average types and Z-Score calculation offers traders and investors powerful analytical tools. It can be used for trend following strategies by analyzing the oscillator's position relative to the midline. Traders can also employ it as a mean reversion tool by identifying peak values above user-defined deviations. These features assist in identifying potential entry and exit points, enhancing trading decisions and market analysis.
Key Features:
Variety of 13 MA types.
Potential reversal point bubbles.
Bar coloring methods - Trend (Midline cross), Extremities, Reversions, Slope
Example Charts:

Mad_MATHLibrary "MAD_MATH"
This is a mathematical library where I store useful kernels, filters and selectors for the different types of computations.
This library also contains opensource code from other scripters.
Future extensions are very likely, there are some functions I would like to add, but I have to wait for approvals so i can include them.
Ehlers_EMA(_src, _length)
Calculates the Ehlers Exponential Moving Average (Ehlers_EMA)
Parameters:
_src (float) : The source series for calculation
_length (simple int) : The length for the Ehlers EMA
Returns: The Ehlers EMA value
Ehlers_Gaussian(_src, _length)
Calculates the Ehlers Gaussian Filter
Parameters:
_src (float) : The source series for calculation
_length (simple int) : The length for the Ehlers Gaussian Filter
Returns: The Ehlers Gaussian Filter value
Ehlers_supersmoother(_src, _length)
Calculates the Ehlers Supersmoother
Parameters:
_src (float) : The source series for calculation
_length (simple int) : The length for the Ehlers Supersmoother
Returns: The Ehlers Supersmoother value
Ehlers_SMA_fast(_src, _length)
Calculates the Ehlers Simple Moving Average (SMA) Fast
Parameters:
_src (float) : The source series for calculation
_length (simple int) : The length for the Ehlers SMA Fast
Returns: The Ehlers SMA Fast value
Ehlers_EMA_fast(_src, _length)
Calculates the Ehlers Exponential Moving Average (EMA) Fast
Parameters:
_src (float) : The source series for calculation
_length (simple int) : The length for the Ehlers EMA Fast
Returns: The Ehlers EMA Fast value
Ehlers_RSI_fast(_src, _length)
Calculates the Ehlers Relative Strength Index (RSI) Fast
Parameters:
_src (float) : The source series for calculation
_length (simple int) : The length for the Ehlers RSI Fast
Returns: The Ehlers RSI Fast value
Ehlers_Band_Pass_Filter(_src, _length)
Calculates the Ehlers BandPass Filter
Parameters:
_src (float) : The source series for calculation
_length (simple int) : The length for the Ehlers BandPass Filter
Returns: The Ehlers BandPass Filter value
Ehlers_Butterworth(_src, _length)
Calculates the Ehlers Butterworth Filter
Parameters:
_src (float) : The source series for calculation
_length (simple int) : The length for the Ehlers Butterworth Filter
Returns: The Ehlers Butterworth Filter value
Ehlers_Two_Pole_Gaussian_Filter(_src, _length)
Calculates the Ehlers Two-Pole Gaussian Filter
Parameters:
_src (float) : The source series for calculation
_length (simple int) : The length for the Ehlers Two-Pole Gaussian Filter
Returns: The Ehlers Two-Pole Gaussian Filter value
Ehlers_Two_Pole_Butterworth_Filter(_src, _length)
Calculates the Ehlers Two-Pole Butterworth Filter
Parameters:
_src (float) : The source series for calculation
_length (simple int) : The length for the Ehlers Two-Pole Butterworth Filter
Returns: The Ehlers Two-Pole Butterworth Filter value
Ehlers_Band_Stop_Filter(_src, _length)
Calculates the Ehlers Band Stop Filter
Parameters:
_src (float) : The source series for calculation
_length (simple int) : The length for the Ehlers Band Stop Filter
Returns: The Ehlers Band Stop Filter value
Ehlers_Smoother(_src)
Calculates the Ehlers Smoother
Parameters:
_src (float) : The source series for calculation
Returns: The Ehlers Smoother value
Ehlers_High_Pass_Filter(_src, _length)
Calculates the Ehlers High Pass Filter
Parameters:
_src (float) : The source series for calculation
_length (simple int) : The length for the Ehlers High Pass Filter
Returns: The Ehlers High Pass Filter value
Ehlers_2_Pole_High_Pass_Filter(_src, _length)
Calculates the Ehlers Two-Pole High Pass Filter
Parameters:
_src (float) : The source series for calculation
_length (simple int) : The length for the Ehlers Two-Pole High Pass Filter
Returns: The Ehlers Two-Pole High Pass Filter value
pr(_src, _length)
pr Calculates the percentage rank (PR) of a value within a range.
Parameters:
_src (float) : The source value for which the percentage rank is calculated. It represents the value to be ranked within the range.
_length (simple int) : The _length of the range over which the percentage rank is calculated. It determines the number of bars considered for the calculation.
Returns: The percentage rank (PR) of the source value within the range, adjusted by adding 50 to the result.
smma(_src, _length)
Calculates the SMMA (Smoothed Moving Average)
Parameters:
_src (float) : The source series for calculation
_length (simple int)
Returns: The SMMA value
hullma(_src, _length)
Calculates the Hull Moving Average (HullMA)
Parameters:
_src (float) : The source series for calculation
_length (simple int) : The _length of the HullMA
Returns: The HullMA value
tma(_src, _length)
Calculates the Triple Moving Average (TMA)
Parameters:
_src (float) : The source series for calculation
_length (simple int) : The _length of the TMA
Returns: The TMA value
dema(_src, _length)
Calculates the Double Exponential Moving Average (DEMA)
Parameters:
_src (float) : The source series for calculation
_length (simple int) : The _length of the DEMA
Returns: The DEMA value
tema(_src, _length)
Calculates the Triple Exponential Moving Average (TEMA)
Parameters:
_src (float) : The source series for calculation
_length (simple int) : The _length of the TEMA
Returns: The TEMA value
w2ma(_src, _length)
Calculates the Normalized Double Moving Average (N2MA)
Parameters:
_src (float) : The source series for calculation
_length (simple int) : The _length of the N2MA
Returns: The N2MA value
wma(_src, _length)
Calculates the Normalized Moving Average (NMA)
Parameters:
_src (float) : The source series for calculation
_length (simple int) : The _length of the NMA
Returns: The NMA value
nma(_open, _close, _length)
Calculates the Normalized Moving Average (NMA)
Parameters:
_open (float) : The open price series
_close (float) : The close price series
_length (simple int) : The _length for finding the highest and lowest values
Returns: The NMA value
lma(_src, _length)
Parameters:
_src (float)
_length (simple int)
zero_lag(_src, _length, gamma1, zl)
Calculates the Zero Lag Moving Average (ZeroLag)
Parameters:
_src (float) : The source series for calculation
_length (simple int) : The length for the moving average
gamma1 (simple int) : The coefficient for calculating 'd'
zl (simple bool) : Boolean flag for applying Zero Lag
Returns: An array containing the ZeroLag Moving Average and a boolean flag indicating if it's flat
copyright HPotter, thanks for that great function
chebyshevI(src, len, ripple)
Calculates the Chebyshev Type I Filter
Parameters:
src (float) : The source series for calculation
len (int) : The length of the filter
ripple (float) : The ripple factor for the filter
Returns: The output of the Chebyshev Type I Filter
math from Pafnuti Lwowitsch Tschebyschow (1821–1894)
Thanks peacefulLizard50262 for the find and translation
chebyshevII(src, len, ripple)
Calculates the Chebyshev Type II Filter
Parameters:
src (float) : The source series for calculation
len (int) : The length of the filter
ripple (float) : The ripple factor for the filter
Returns: The output of the Chebyshev Type II Filter
math from Pafnuti Lwowitsch Tschebyschow (1821–1894)
Thanks peacefulLizard50262 for the find
wavetrend(_src, _n1, _n2)
Calculates the WaveTrend indicator
Parameters:
_src (float) : The source series for calculation
_n1 (simple int) : The period for the first EMA calculation
_n2 (simple int) : The period for the second EMA calculation
Returns: The WaveTrend value
f_getma(_type, _src, _length, ripple)
Calculates various types of moving averages
Parameters:
_type (simple string) : The type of indicator to calculate
_src (float) : The source series for calculation
_length (simple int) : The length for the moving average or indicator
ripple (simple float)
Returns: The calculated moving average or indicator value
f_getfilter(_type, _src, _length)
Calculates various types of filters
Parameters:
_type (simple string) : The type of indicator to calculate
_src (float) : The source series for calculation
_length (simple int) : The length for the moving average or indicator
Returns: The filtered value
f_getoszillator(_type, _src, _length)
Calculates various types of Deviations and other indicators
Parameters:
_type (simple string) : The type of indicator to calculate
_src (float) : The source series for calculation
_length (simple int) : The length for the moving average or indicator
Returns: The calculated moving average or indicator value

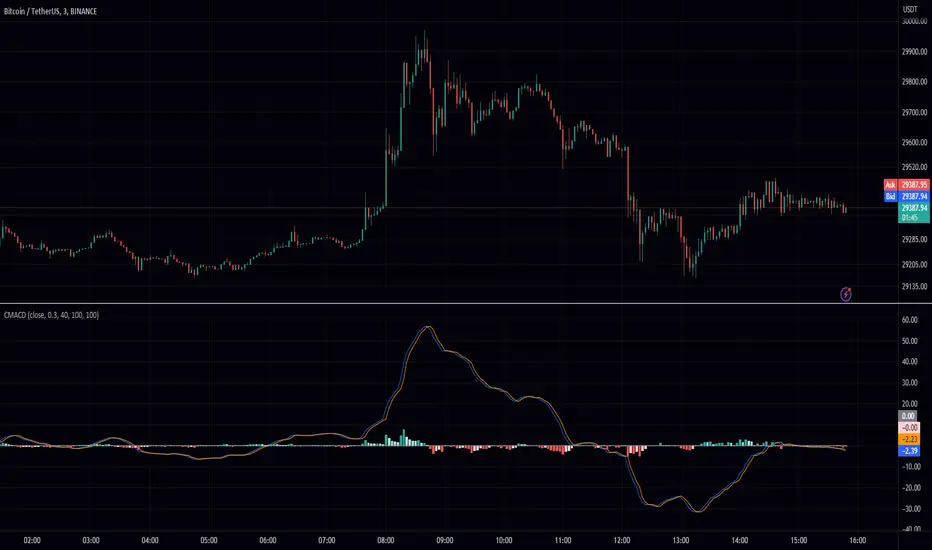
MACD Chebyshev (CMACD)Introducing the Advanced MACD Chebyshev Indicator
Enhanced Convergence Divergence with Gate Compressor for Improved Trading Signals
Introduction
We are excited to introduce a new, advanced Moving Average Convergence Divergence (MACD) indicator that we've developed, called the MACD Chebyshev (CMACD). This innovative indicator uses the dominant period to determine the frequency of the band pass and employs a delayed version of the signal for better convergence divergence. To further enhance the quality of the signals, we've incorporated a gate compressor in the histogram. In this blog post, we will provide an extensive overview of the CMACD indicator, detailing its features and explaining how it works.
The MACD Chebyshev Indicator
The CMACD indicator is based on the well-known MACD indicator, which is a popular technical analysis tool for identifying potential trend reversals in financial markets. The MACD indicator calculates the difference between two Exponential Moving Averages (EMAs) and plots a histogram to represent the convergence and divergence between these EMAs. The CMACD indicator builds on this concept by using the Chebyshev Type I and Type II Moving Averages, which offer superior smoothing and reduced lag compared to traditional EMAs.
The main components of the CMACD indicator are:
1. Signal Line (Blue Line)
2. Delay Line (Orange Line)
3. Histogram (Green and Red bars)
4. Zero Line (Gray Line)
The indicator calculates the difference between the two Chebyshev Moving Averages and plots the histogram based on this difference. The histogram bars change color depending on whether they are above or below the zero line and whether they are growing or falling.
Custom Functions and Features
The CMACD indicator includes several custom functions and features that set it apart from the standard MACD indicator:
1. Dominant Period: The CMACD indicator uses the dominant period to determine the frequency of the band pass. This ensures that the indicator is more responsive to the current market conditions, as it adapts to the dominant cycle in the price data.
2. Delayed Signal: The CMACD indicator employs a delayed version of the signal to provide better convergence divergence. This helps to reduce false signals and improve the accuracy of the indicator.
3. Ripple: The Ripple parameter allows users to adjust the smoothing factor of the Chebyshev Moving Averages. This can be customized to suit individual trading preferences and strategies.
4. Gate Compressor: The CMACD indicator incorporates a gate compressor in the histogram. This unique feature allows users to specify a Percent Rank for the gate signal level, a Gate Ratio, and a Knee Type (either "hard" or "soft"). The gate compressor works by reducing the amplitude of the histogram bars when their absolute value is below the specified threshold. This helps to filter out noise and improve the clarity of the signals generated by the indicator.
Color Scheme
The CMACD indicator features an intuitive color scheme for easy interpretation of the histogram:
1. Green Bars (Above Zero Line): The histogram bars are green when they are above the zero line. The darker green color indicates a growing bar, while the lighter green color represents a falling bar.
2. Red Bars (Below Zero Line): The histogram bars are red when they are below the zero line. The darker red color indicates a growing bar, while the lighter red color represents a falling bar.
Conclusion
The MACD Chebyshev (CMACD) indicator is an innovative and powerful tool for technical analysis, offering superior performance compared to the standard MACD indicator. With its advanced features, such as the dominant period, delayed signal, ripple adjustment, and gate compressor, the CMACD indicator provides more accurate and reliable trading signals. Incorporate the CMACD indicator into your trading strategy today and experience the enhanced convergence divergence for better trading decisions.
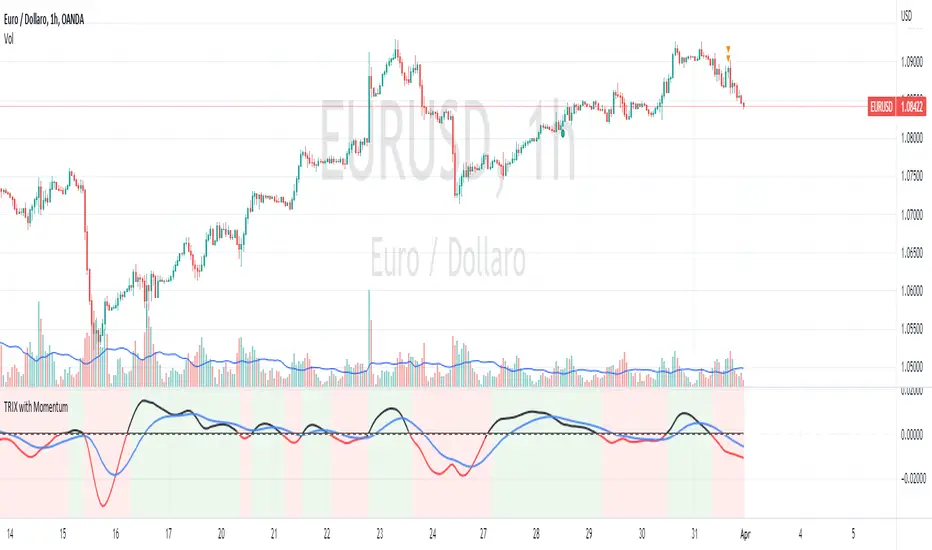
TRIX with Momentum----------- ENGLISH --------------
This indicator is called "TRIX with Momentum" and is used to analyze the momentum of an asset's price and predict potential trend reversals. The logic of operation is based on the combination of two indicators: the Triple Exponential Moving Average (TRIX) and the momentum oscillator.
The TRIX is calculated using three exponential moving averages (EMA) of the asset's closing price, with a user-defined length (set to 14 by default). The TRIX is then normalized and centered around 0 to facilitate analysis of its relationship with the momentum oscillator.
The momentum oscillator is calculated using the EMA of the normalized TRIX with a user-defined length (set to 14 by default).
The indicator plots the normalized TRIX and the momentum oscillator on a chart, using different colors to indicate whether the TRIX is above or below 0. Additionally, the color of the y-axis label changes based on the position of the oscillator, while the color of the x-axis label remains gray.
The indicator uses a weighted average between the normalized TRIX and the momentum oscillator to create a colored background of the chart, which changes based on the weighted average. If the weighted average is positive, the chart's background is green, otherwise it is red. Finally, a horizontal line is drawn at point 0 to facilitate visual analysis of the chart.
------------ ITALIANO -------------
Questo indicatore è chiamato "TRIX with Momentum" ed è utilizzato per analizzare il momentum del prezzo di un asset e prevedere eventuali inversioni di trend. La logica di funzionamento è basata sulla combinazione di due indicatori: il TRIX (Indicatori di media mobile Tripla Esponenziale) e l'oscillatore momentum.
L'indicatore consente all'utente di impostare la lunghezza del TRIX e dell'oscillatore momentum come input personalizzato. Il TRIX viene calcolato utilizzando tre medie mobili esponenziali (EMA) della chiusura dei prezzi dell'asset, mentre l'oscillatore momentum viene calcolato utilizzando l'EMA del TRIX normalizzato.
Il TRIX normalizzato viene centrato intorno allo 0 per facilitare l'analisi della sua relazione con l'oscillatore momentum. L'indicatore plotta il TRIX normalizzato e l'oscillatore momentum su un grafico, utilizzando diversi colori per indicare se il TRIX è sopra o sotto lo 0.
L'indicatore utilizza una media pesata tra il TRIX normalizzato e l'oscillatore momentum per creare uno sfondo colorato del grafico, che cambia in base alla media pesata. L'utente può impostare il peso da dare al TRIX e all'oscillatore momentum come input personalizzato, e il peso dell'oscillatore momentum verrà automaticamente impostato come complementare al peso del TRIX.
Se la media pesata è positiva, lo sfondo del grafico è verde, altrimenti è rosso. Viene tracciata anche una linea orizzontale al punto 0 per facilitare l'analisi visiva del grafico.
Infine, il colore dell'etichetta dell'asse y cambia in base alla posizione dell'oscillatore, mentre il colore dell'etichetta dell'asse x rimane sempre grigio.
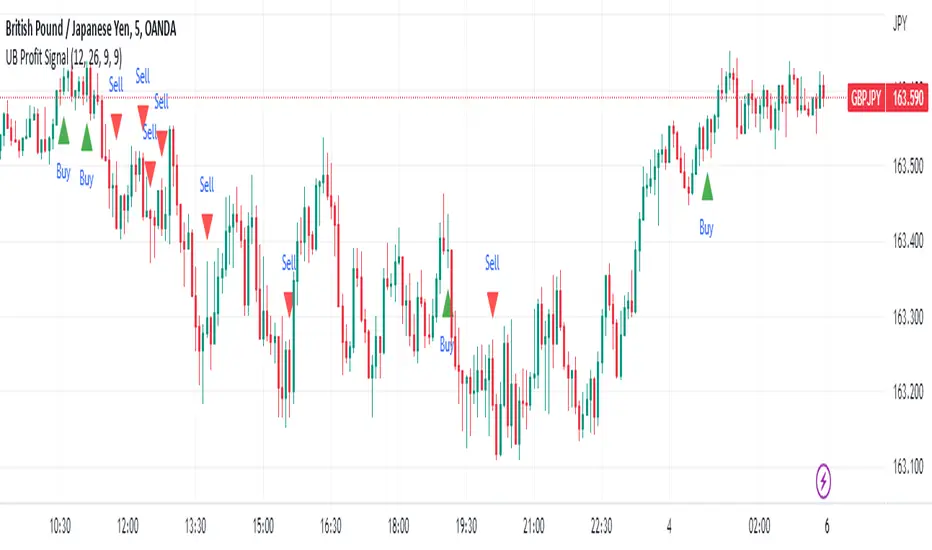
UB Profit Signal IndicatorThe UB Profit Signal indicator is a technical analysis tool designed to identify potential buy and sell signals in the market. The indicator is based on four technical indicators - Moving Average Convergence Divergence (MACD), Relative Strength Index (RSI), Bollinger Bands (BB), and volume moving average.
The script starts by defining input variables such as MACD Fast Length, MACD Slow Length, MACD Signal Length, RSI Length, etc. These variables are used to customize the indicator based on the user's preference.
The MACD is calculated using the ta.macd function, which returns three variables: the MACD Line, Signal Line, and Histogram. The MACD line is calculated as the difference between two exponential moving averages of the price. The signal line is a moving average of the MACD line. The histogram shows the difference between the MACD line and the signal line.
The RSI is calculated using the ta.rsi function, which calculates the RSI value based on the number of periods specified in the RSI Length input variable. The RSI is a momentum oscillator that measures the speed and change of price movements.
The Bollinger Bands are calculated using the ta.sma and ta.stdev functions. The Simple Moving Average (SMA) is calculated using the close price over 21 periods, while the Standard Deviation is calculated using the close price over the same 21 periods. The upper and lower bands are then calculated based on the SMA and Standard Deviation.
Finally, the buy and sell signals are generated based on specific conditions that combine the MACD, RSI, and BB values. For example, a buy signal is generated when the RSI value is greater than 30, the volume is greater than the volume moving average, the close price is greater than the 9-period SMA, and the close price is between the upper and lower BBs. Similarly, a sell signal is generated when the RSI value is less than 40, the volume is greater than the volume moving average, the close price is less than the 9-period SMA, and the close price is between the upper and lower BBs.
The buy and sell signals are plotted on the chart using the plotshape function, which creates triangular shapes above and below the bars to indicate the signals. Green triangles indicate a buy signal, while red triangles indicate a sell signal. Overall, the UB Profit Signal indicator can be useful for traders looking to identify potential buy and sell signals in the market and take advantage of price movements.
ATR PivotsThe "ATR Pivots" script is a technical analysis tool designed to help traders identify key levels of support and resistance on a chart. The indicator uses various metrics such as the Average True Range (ATR), Daily True Range ( DTR ), Daily True Range Percentage (DTR%), Average Daily Range (ADR), Previous Day High ( PDH ), and Previous Day Low ( PDL ) to provide a comprehensive picture of the volatility and movement of a security. The script also includes an EMA cloud and 200 EMA for trend identification and a 1-minute ATR scalping strategy for traders to make informed trading decisions.
ATR Detail:-
The ATR is a measure of the volatility of a security over a given period of time. It is calculated by taking the average of the true range (the difference between the high and low of a security) over a set number of periods. The user can input the number of periods (ATR length) to be used for the ATR calculation. The script also allows the user to choose whether to use the current close or not for the calculation. The script calculates various levels of support and resistance based on the relationship between the security's range ( high-low ) and the ATR. The levels are calculated by multiplying the ATR by different Fibonacci ratios (0.236, 0.382, 0.5, 0.618, 0.786, 1.000) and then adding or subtracting the result from the previous close. The script plots these levels on the chart, with the -100 level being the most significant level. The user also has an option to choose whether to plot all Fibonacci levels or not.
DTR and DTR% Detail:-
The Daily True Range Percentage (DTR%) is a metric that measures the daily volatility of a security as a percentage of its previous close. It is calculated by dividing the Daily True Range ( DTR ) by the previous close. DTR is the range between the current period's high and low and gives a measure of the volatility of the security on a daily basis. DTR% can be used as an indicator of the percentage of movement of the security on a daily basis. In this script, DTR% is used in combination with other metrics such as the Average True Range (ATR) and Fibonacci ratios to calculate key levels of support and resistance for the security. The idea behind using DTR% is that it can help traders to better understand the daily volatility of the security and make more informed trading decisions.
For example, if a security has a DTR% of 2%, it suggests that the security has a relatively low level of volatility and is less likely to experience significant price movements on a daily basis. On the other hand, if a security has a DTR% of 10%, it suggests that the security has a relatively high level of volatility and is more likely to experience significant price movements on a daily basis.
ADR:-
The script then calculates the ADR (Average Daily Range) which is the average of the daily range of the security, using the formula (Period High - Period Low) / ATR Length. This gives a measure of the average volatility of the security on a daily basis, which can be useful for determining potential levels of support and resistance .
PDH /PDL:-
The script also calculates PDH (Previous Day High) and PDL (Previous Day Low) which are the High and low of the previous day of the security. This gives a measure of the previous day's volatility and movement, which can be useful for determining potential levels of support and resistance .
EMA Cloud and 200 EMA Detail:-
The EMA cloud is a technical analysis tool that helps traders identify the trend of the market by comparing two different exponential moving averages (EMAs) of different lengths. The cloud is created by plotting the fast EMA and the slow EMA on the chart and filling the space between them. The user can input the length of the fast and slow EMA , and the script will calculate and plot these EMAs on the chart. The space between the two EMAs is then filled with a color that represents the trend, with green indicating a bullish trend and red indicating a bearish trend . Additionally, the script also plots a 200 EMA , which is a commonly used long-term trend indicator. When the fast EMA is above the slow EMA and the 200 EMA , it is considered a bullish signal, indicating an uptrend. When the fast EMA is below the slow EMA and the 200 EMA , it is considered a bearish signal, indicating a downtrend. The EMA cloud and 200 EMA can be used together to help traders identify the overall trend of the market and make more informed trading decisions.
1 Minute ATR Scalping Strategy:-
The script also includes a 1-minute ATR scalping strategy that can be used by traders looking for quick profits in the market. The strategy involves using the ATR levels calculated by the script as well as the EMA cloud and 200 EMA to identify potential buy and sell opportunities. For example, if the 1-minute ATR is above 11 in NIFTY and the EMA cloud is bullish , the strategy suggests buying the security. Similarly, if the 1-minute ATR is above 30 in BANKNIFTY and the EMA cloud is bullish , the strategy suggests buying the security.
Inside Candle:-
The Inside Candle is a price action pattern that occurs when the current candle's high and low are entirely within the range of the previous candle's high and low. This pattern indicates indecision or consolidation in the market and can be a potential sign of a trend reversal. When used in the 15-minute chart, traders can look for Inside Candle patterns that occur at key levels of support or resistance. If the Inside Candle pattern occurs at a key level and the price subsequently breaks out of the range of the Inside Candle, it can be a signal to enter a trade in the direction of the breakout. Traders can also use the Inside Candle pattern to trade in a tight range, or to reduce their exposure to a current trend.
Risk Management:-
As with any trading strategy, it is important to practice proper risk management when using the ATR Pivots script and the 1-minute ATR scalping strategy. This may include setting stop-loss orders, using appropriate position sizing, and diversifying your portfolio. It is also important to note that past performance is not indicative of future results and that the script and strategy provided are for educational purposes only.
In conclusion, the "ATR Pivots" script is a powerful tool that can help traders identify key levels of support and resistance , as well as trend direction. The additional metrics such as DTR , DTR%, ADR, PDH , and PDL provide a more comprehensive picture of the volatility and movement of the security, making it easier for traders to make better trading decisions. The inclusion of the EMA cloud and 200 EMA for trend identification, and the 1-minute ATR scalping strategy for quick profits can further enhance a trader's decision-making process. However, it is important to practice proper risk management and understand that past performance is not indicative of future results.
Special thanks to satymahajan for the idea of clubbing Average True Range with Fibonacci levels.

oussamacryptoWhat Is an Exponential Moving Average (EMA)?
An exponential moving average (EMA) is a type of moving average (MA) that places a greater weight and significance on the most recent data points. The exponential moving average is also referred to as the exponentially weighted moving average. An exponentially weighted moving average reacts more significantly to recent price changes than a simple moving average simple moving average (SMA), which applies an equal weight to all observations in the period.

Fisher Transform of MACD w/ Quantile Bands [Loxx]Fisher Transform of MACD w/ Quantile Bands is a Fisher Transform indicator with Quantile Bands that takes as it's source a MACD. The MACD has two different source inputs for fast and slow moving averages.
What is Fisher Transform?
The Fisher Transform is a technical indicator created by John F. Ehlers that converts prices into a Gaussian normal distribution.
The indicator highlights when prices have moved to an extreme, based on recent prices. This may help in spotting turning points in the price of an asset. It also helps show the trend and isolate the price waves within a trend.
What is Quantile Bands?
In statistics and the theory of probability, quantiles are cutpoints dividing the range of a probability distribution into contiguous intervals with equal probabilities, or dividing the observations in a sample in the same way. There is one less quantile than the number of groups created. Thus quartiles are the three cut points that will divide a dataset into four equal-size groups (cf. depicted example). Common quantiles have special names: for instance quartile, decile (creating 10 groups: see below for more). The groups created are termed halves, thirds, quarters, etc., though sometimes the terms for the quantile are used for the groups created, rather than for the cut points.
q-Quantiles are values that partition a finite set of values into q subsets of (nearly) equal sizes. There are q − 1 of the q-quantiles, one for each integer k satisfying 0 < k < q. In some cases the value of a quantile may not be uniquely determined, as can be the case for the median (2-quantile) of a uniform probability distribution on a set of even size. Quantiles can also be applied to continuous distributions, providing a way to generalize rank statistics to continuous variables. When the cumulative distribution function of a random variable is known, the q-quantiles are the application of the quantile function (the inverse function of the cumulative distribution function) to the values {1/q, 2/q, …, (q − 1)/q}.
What is MACD?
Moving average convergence divergence ( MACD ) is a trend-following momentum indicator that shows the relationship between two moving averages of a security’s price. The MACD is calculated by subtracting the 26-period exponential moving average ( EMA ) from the 12-period EMA .
Included:
Zero-line and signal cross options for bar coloring, signals, and alerts
Alerts
Signals
Loxx's Expanded Source Types
35+ moving average types

STD Stepped Ehlers Optimal Tracking Filter MTF w/ Alerts [Loxx]STD Stepped Ehlers Optimal Tracking Filter MTF w/ Alerts is the traditional Ehlers Optimal Tracking Filter but with stepped price levels, access to multiple time frames, and alerts.
What is Ehlers Optimal Tracking Filter?
From "OPTIMAL TRACKING FILTERS" by John Ehlers:
"Dr. R.E. Kalman introduced his concept of optimum estimation in 1960. Since that time, his technique has proven to be a powerful and practical tool. The approach is particularly well suited for optimizing the performance of modern terrestrial and space navigation systems. Many traders not directly involved in system analysis have heard about Kalman filtering and have expressed an interest in learning more about it for market applications. Although attempts have been made to provide simple, intuitive explanations, none has been completely successful. Almost without exception, descriptions have become mired in the jargon and state-space notation of the “cult”.
Surprisingly, in spite of the obscure-looking mathematics (the most impenetrable of which can be found in Dr. Kalman’s original paper), Kalman filtering is a fairly direct and simple concept. In the spirit of being pragmatic, we will not deal with the full-blown matrix equations in this description and we will be less than rigorous in the application to trading. Rigorous application requires knowledge of the probability distributions of the statistics. Nonetheless we end with practically useful results. We will depart from the classical approach by working backwards from Exponential Moving Averages. In this process, we introduce a way to create a nearly zero lag moving average. From there, we will use the concept of a Tracking Index that optimizes the filter tracking for the given uncertainty in price movement and the uncertainty in our ability to measure it."
Included:
-Standard deviation stepping filter, price is required to exceed XX deviations before the moving average line shifts direction
-Selection of filtering based on source price, the moving average, or both; you can also set the Filter deviations to 0 for no filtering at all
-Toggle on/off bar coloring
-Toggle on/off signals
-Long/Short alerts

AMASling - All Moving Average Sling ShotThis indicator modifies the SlingShot System by Chris Moody to allow it to be based on 'any' Fast and Slow moving average pair. Open Long / Close Long / Open Short / Close Short alerts can be generated for automated bot trading based on the SlingShot strategy:
• Conservative Entry = Fast MA above Slow MA, and previous bar close below Fast MA, and current price above Fast MA
• Conservative Entry = Fast MA below Slow MA, and previous bar close above Fast MA, and current price below Fast MA
• Aggressive Entry = Fast MA above Slow MA, and price below Fast MA
• Aggressive Exit = Fast MA below Slow MA, and price above Fast MA
Entries and exits can also be made based on moving average crossovers, I initially put this in to make it easy to compare to a more standard strategy, but upon backtesting combining crossovers with the SlingShot appeared to produce better results on some charts.
Alerts can also be filtered to allow long deals only when the fast moving average is above the slow moving average (uptrend) and short deals only when the fast moving average is below the slow moving averages (downtrend).
If you have a strategy that can buy based on External Indicators you can use the 'Backtest Signal' which plots the values set in the 'Long / Short Signals' section.
The Fast, Slow and Signal Moving Averages can be set to:
• Simple Moving Average (SMA)
• Exponential Moving Average (EMA)
• Weighted Moving Average (WMA)
• Volume-Weighted Moving Average (VWMA)
• Hull Moving Average (HMA)
• Exponentially Weighted Moving Average (RMA) (SMMA)
• Linear regression curve Moving Average (LSMA)
• Double EMA (DEMA)
• Double SMA (DSMA)
• Double WMA (DWMA)
• Double RMA (DRMA)
• Triple EMA (TEMA)
• Triple SMA (TSMA)
• Triple WMA (TWMA)
• Triple RMA (TRMA)
• Symmetrically Weighted Moving Average (SWMA) ** length does not apply **
• Arnaud Legoux Moving Average (ALMA)
• Variable Index Dynamic Average (VIDYA)
• Fractal Adaptive Moving Average (FRAMA)
'Backtest Signal' and 'Deal State' are plotted to display.none, so change the Style Settings for the chart if you need to see them for testing.
Yes I did choose the name because 'It's Amasling!'

MTF MACD (PPO) [TANHEF]Mult-Timeframe Moving Average Convergence Divergence (MACD) and Percentage Price Oscillator (PPO) indicator that allows for viewing of 1 to 5 different Timeframes.
Brief Summary
The primary benefit of multi-timeframe indicators is getting better entries and confirmation from viewing multiple time frames at once, which can often get overlooked.
MACD shouldn't be only used by itself, it is a lot more consistent when applied in the same direction as the trend as well as multiple other things including support, resistance, and volume improve the outcomes of the MACD results.
Personally, I look for good entries on higher and lower time frames (multiple timeframes must agree with the buying or selling). For example, if a higher timeframe looks like a good long entry (MACD line is crossing up and below the zero line), then the lower timeframes should be checked to ensure they are not oversold or overextended (the MACD line must be low or below the zero), once the lower and higher timeframes are in agreeance an entry can be made.
What is Moving Average Convergence Divergence (MACD)?
Moving average convergence divergence (MACD) is a trend-following momentum indicator that shows the relationship between two moving averages of the price. The MACD is calculated by subtracting the 26-period exponential moving average (EMA) from the 12-period EMA.
What is the Percentage Price Oscillator (PPO)?
The PPO is identical to the MACD indicator, except the PPO measures percentage difference between two EMAs, while the MACD measures absolute (or dollar) difference. The PPO has the advantage of being comparable to other assets with different prices, whereas MACD readings are not comparable. For example, regardless of the asset's price, a PPO result of 10 means the short-term average is 10% above the long-term average.
A signal line can be displayed on Timeframe, including:
- MACD & Signal Line crosses (Green when MACD above Signal Line and Red when MACD below Signal Line)
- Histogram Direction (fast and slow EMA gap)
- SuperTrend for identifying trend direction (green for uptrend, red for downtrend)
- EMA Trend for identifying trend direction (above EMA = up trend and green, below EMA = down trend and red)
Cross Dots and Potential cross dots
- Green Dot, is displayed when the MACD crosses the Signal Line
- Red Dot, is displayed when the MACD crosses the Signal Line
- Yellow Dot. Potential cross up (green dot) on next bar. Displayed when if the same distance a MACD moves on a bar is applied to the next bar will cause a MACD and Signal Line Cross. This is calculated by checking if the value change of one bar is added to the current MACD value would lead to a cross on the next bar, the it is a potential up dot.
- Purple Dot. Potential cross down (red dot) on next bar. Displayed when if the same distance a MACD moves on a bar is applied to the next bar will cause a MACD and Signal Line Cross. This is calculated by checking if the value change of one bar is added to the current MACD value would lead to a cross on the next bar, the it is a potential down dot.
Best Fit Settings
- Can be applied to the MACD, Signal Line, and Histogram to re-scale (stretch) to fit them within the space of the +2 and -2 range that each timeframe is provided on this indicator.
- The lookback distance value is used to lookback a certain distance to ensure everything scaled to fit well.
Labels are displayed on the right of the indicators, including:
- a label identifying 'line indicator' is currently being displayed
- the Timeframe corresponding to each MACD or PPO indicator
- the MACD or PPO of each Timeframe

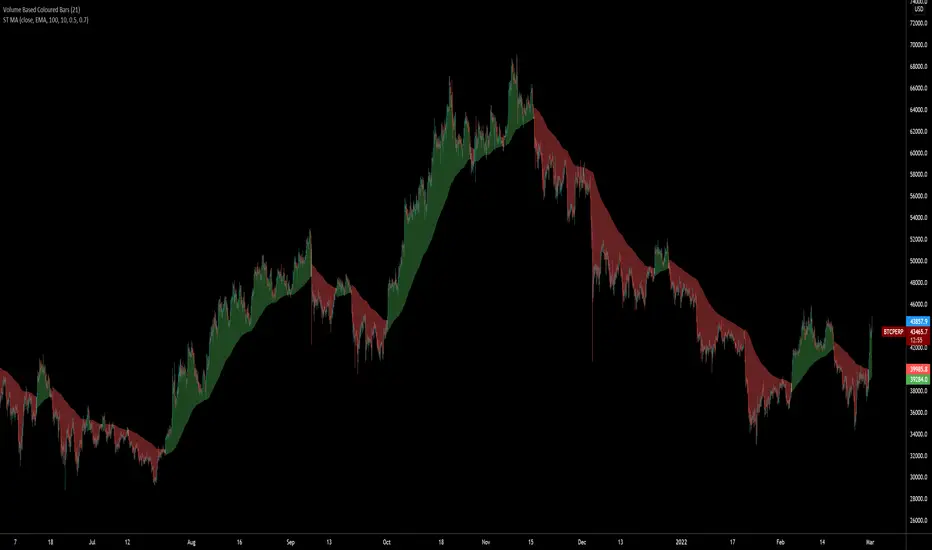
SuperTrended Moving AveragesA different approach to SuperTrend:
adding 100 periods Exponential Moving Average in calculation of SuperTrend and also 0.5 ATR Multiplier to have a clear view of the ongoing trend and also provides significant Supports and Resistances.
Default Moving Average type set as EMA (Exponential Moving Average) but users can choose from 11 different Moving Average types as:
SMA : Simple Moving Average
EMA : Exponential Moving Average
WMA : Weighted Moving Average
DEMA : Double Exponential Moving Average
TMA : Triangular Moving Average
VAR : Variable Index Dynamic Moving Average a.k.a. VIDYA
WWMA : Welles Wilder's Moving Average
ZLEMA : Zero Lag Exponential Moving Average
TSF : True Strength Force
HULL : Hull Moving Average
TILL : Tillson T3 Moving Average
Credits going to @CryptoErge for sharing his development to public.
Multi-X by HamidBoxHello to All, introducing Multi Types Crossover strategy,
simply the best way of trading with Crossover and Crossunder Strategy, How it Works???
I added 5 types of Moving Averages,
1: Simple Moving Average ( SMA )
2: Exponential Moving Average ( EMA )
3: Weighted Moving Average ( WMA )
4: Volume Weighted Moving Average ( VWMA )
5: Relative Moving Average (RMA)
With this indicator, you can do scalping, You can trade not only with similar types of Moving Average indicators but also with different types of Moving Average indicators.
what is mean? like: Normal Condition is:
( Simple Moving Average ) Crossover to ( Simple Moving Average ), SMA x SMA
( Exponential Moving Average ) Crossover to ( Exponential Moving Average ), EMA x EMA
But we can Crossover with:
( Exponential Moving Average ) Crossover to ( Simple Moving Average ), EMA x SMA
( Simple Moving Average ) Crossover to ( Weighted Moving Average ), SMA x WMA
( Weighted Moving Average ) Crossover to ( Weighted Moving Average ), WMA x WMA
( Simple Moving Average ) Crossover to (Relative Moving Average), WMA x RMA
and also I added Moving Average ZONE in this tool, What does it work???
The zone will tell us what type of direction the market has, if the market is above the zone, it's mean we have a Bullish Trend, and if the market is below the zone, it means the market has a Bearish Trend,
so if you want to play on the safe side, never trade when the market is in Bearish Trend, and if you want to play on aggressive mood, you can skip Moving Average Zone section.

SMA Simple, EMA Exponential Moving Averages with high lowThis is a rewrite of my previous moving average script.
In this version, I have added the 3 day high and low as these are often used as short term trend following entry points
Traders often try to buy the 3 day average of lows in an uptrend and sell the 3 day average of highs in a downtrend
In the same fashion, I have added the 3 week high and low averages for longer term trend following for swing trading
I have added the 18 day, week, month simple moving averages ( SMA ) as I follow these from Ira Epsteins free you tube trading videos).
His 50 years of experience has taught him these are best
I have also added some longer term SMA , 100 day, 200 day, 100w, and 200w
Exponential EMA averages for longer term charts are included 100d, 200d, 100w, 100m, 200m
You can configure the script in the options to remove the ones you don't want to follow
I have removed the micro averages from my previous script since they are for short term scalping day trading hyper-trading which I don't do
Exponential averages are shown as crosses
some of the longer term averages are circles just to set them apart
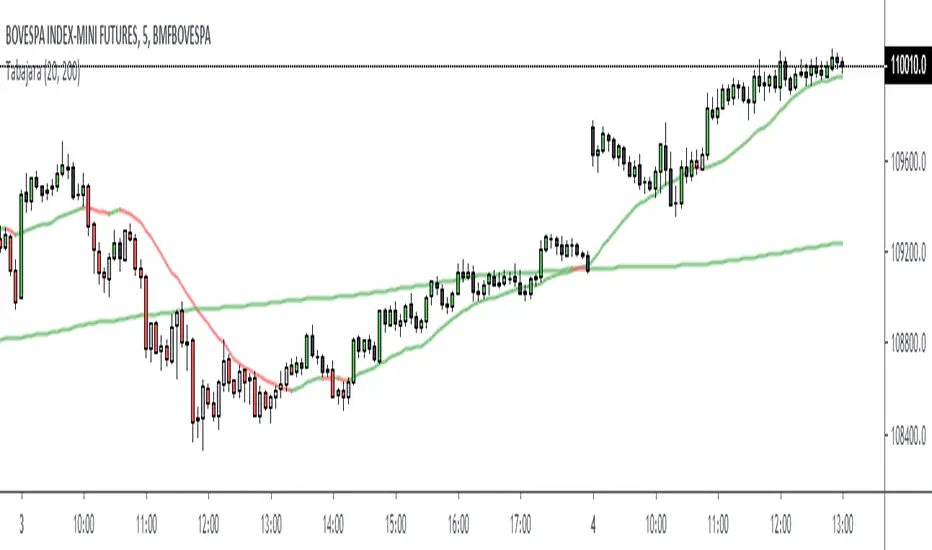
Tabajara simple versionIndicator Tabajara from the brazilian trader André Machado.
Simple version with moving averages SMA 20 and SMA 200.
If fast moving average (20) is ascending, positive candles will receive green color.
Descending fast moving average (20) makes negative candles receive red color.
In other cases the candles will be gray (positive) and black (negative).
The slow moving average (SMA 200) shows the primary trend.
It´s also possible using the indicator with exponential moving averages.
Well Rounded Moving AverageIntroduction
There are tons of filters, way to many, and some of them are redundant in the sense they produce the same results as others. The task to find an optimal filter is still a big challenge among technical analysis and engineering, a good filter is the Kalman filter who is one of the more precise filters out there. The optimal filter theorem state that : The optimal estimator has the form of a linear observer , this in short mean that an optimal filter must use measurements of the inputs and outputs, and this is what does the Kalman filter. I have tried myself to Kalman filters with more or less success as well as understanding optimality by studying Linear–quadratic–Gaussian control, i failed to get a complete understanding of those subjects but today i present a moving average filter (WRMA) constructed with all the knowledge i have in control theory and who aim to provide a very well response to market price, this mean low lag for fast decision timing and low overshoots for better precision.
Construction
An good filter must use information about its output, this is what exponential smoothing is about, simple exponential smoothing (EMA) is close to a simple moving average and can be defined as :
output = output(1) + α(input - output(1))
where α (alpha) is a smoothing constant, typically equal to 2/(Period+1) for the EMA.
This approach can be further developed by introducing more smoothing constants and output control (See double/triple exponential smoothing - alpha-beta filter) .
The moving average i propose will use only one smoothing constant, and is described as follow :
a = nz(a ) + alpha*nz(A )
b = nz(b ) + alpha*nz(B )
y = ema(a + b,p1)
A = src - y
B = src - ema(y,p2)
The filter is divided into two components a and b (more terms can add more control/effects if chosen well) , a adjust itself to the output error and is responsive while b is independent of the output and is mainly smoother, adding those components together create an output y , A is the output error and B is the error of an exponential moving average.
Comparison
There are a lot of low-lag filters out there, but the overshoots they induce in order to reduce lag is not a great effect. The first comparison is with a least square moving average, a moving average who fit a line in a price window of period length .
Lsma in blue and WRMA in red with both length = 100 . The lsma is a bit smoother but induce terrible overshoots
ZLMA in blue and WRMA in red with both length = 100 . The lag difference between each moving average is really low while VWRMA is way more precise.
Hull MA in blue and WRMA in red with both length = 100 . The Hull MA have similar overshoots than the LSMA.
Reduced overshoots moving average (ROMA) in blue and WRMA in red with both length = 100 . ROMA is an indicator i have made to reduce the overshoots of a LSMA, but at the end WRMA still reduce way more the overshoots while being smoother and having similar lag.
I have added a smoother version, just activate the extra smooth option in the indicator settings window. Here the result with length = 200 :
This result is a little bit similar to a 2 order Butterworth filter. Our filter have more overshoots which in this case could be useful to reduce the error with edges since other low pass filters tend to smooth their amplitude thus reducing edge estimation precision.
Conclusions
I have presented a well rounded filter in term of smoothness/stability and reactivity. Try to add more terms to have different results, you could maybe end up with interesting results, if its the case share them with the community :)
As for control theory i have seen neural networks integrated to Kalman flters which leaded to great accuracy, AI is everywhere and promise to be a game a changer in real time data smoothing. So i asked myself if it was possible for a neural networks to develop pinescript indicators, if yes then i could be replaced by AI ? Brrr how frightening.
Thanks for reading :)

MACD percentage price oscillatorMACD Percentage Price Oscillator is a variation of the MACD indicator. Signal line crossovers are almost identical. The major difference is the MACD Percentage scale which enables comparison between stocks at different prices.
MACD Percentage Price Oscillator's trading signals are the same as for the MACD indicator. The MACD indicator is primarily used to trade trends and should not be used in a ranging market. Signals are taken when MACD crosses its signal line, calculated as a 9 day exponential moving average of MACD.
First check whether price is trending. If the MACD indicator is flat or stays close to the zero line, the market is ranging and signals are unreliable.
Signals are far stronger if there is either:
- a divergence on the MACD indicator; or
- a large swing above or below the zero line.
- Unless there is a divergence, do not go long if the signal is above the zero line, nor go short if the signal is below zero. Place stop-losses below the last minor Low when long, or the last minor High when short.
The main advantage of MACD Percentage over MACD is the ability to compare indicator values across stocks.
The only difference with MACD Percentage Price Oscillator is that the difference between the fast and slow moving averages is calculated as a percentage of the slow moving average: MACD = (12 Day EMA - 26 Day EMA) / 26 Day EMA

Impulse Trend Levels [BOSWaves]Impulse Trend Levels - Momentum-Adaptive Trend Detection with Impulse-Driven Confidence Bands
Overview
Impulse Trend Levels is a momentum-aware trend identification system that tracks directional price movement through adaptive confidence bands, where band width dynamically adjusts based on impulse strength and freshness to reflect real-time conviction in the current trend direction.
Instead of relying on fixed moving average crossovers or static band multipliers, trend state, band positioning, and zone thickness are determined through impulse detection patterns, exponential decay modeling, and volatility-normalized momentum measurement.
This creates dynamic trend boundaries that reflect actual momentum intensity rather than arbitrary technical levels - contracting during fresh impulse conditions when trend conviction is high, expanding during impulse decay periods when directional confidence weakens, and incorporating momentum freshness calculations to reveal whether trends are accelerating or deteriorating.
Price is therefore evaluated relative to bands that adapt to momentum state rather than conventional static thresholds.
Conceptual Framework
Impulse Trend Levels is founded on the principle that meaningful trend signals emerge when price momentum intensity reaches significant thresholds relative to recent volatility rather than when price simply crosses moving averages.
Traditional trend-following methods identify directional changes through price-indicator crossovers, which often ignore the underlying momentum dynamics and conviction levels that sustain those moves. This framework replaces static-threshold logic with impulse-driven band construction informed by actual momentum strength and decay characteristics.
Three core principles guide the design:
Trend direction should be determined by volatility-normalized momentum breaches, not simple price crossovers alone.
Band width must adapt to impulse freshness, reflecting real-time confidence in the current trend.
Momentum decay modeling reveals whether trends are maintaining strength or losing conviction.
This shifts trend analysis from static indicator levels into adaptive, momentum-anchored confidence boundaries.
Theoretical Foundation
The indicator combines exponential moving average smoothing, mean absolute deviation measurement, impulse detection methodology, and exponential decay tracking.
An EMA-based trend baseline provides directional reference, while Mean Absolute Deviation (MAD) offers volatility-normalized scaling for momentum measurement. Impulse detection identifies significant price movements relative to recent volatility, triggering fresh momentum readings that decay exponentially over time. Band multipliers interpolate between tight and wide settings based on calculated impulse freshness.
Four internal systems operate in tandem:
Trend Baseline Engine : Computes EMA-smoothed price levels for directional reference and band anchoring.
Volatility Measurement System : Calculates MAD to provide adaptive scaling that normalizes momentum across varying market conditions.
Impulse Detection Logic : Identifies volatility-normalized price movements exceeding threshold levels, capturing momentum intensity and direction.
Decay-Based Confidence Modeling : Applies exponential decay to impulse readings, converting raw momentum into time-weighted freshness metrics that drive band adaptation.
This design allows trend confidence to reflect actual momentum behavior rather than reacting mechanically to price formations.
How It Works
Impulse Trend Levels evaluates price through a sequence of momentum-aware processes:
Baseline Calculation : EMA smoothing of open and close creates a directional trend reference that filters short-term noise.
Volatility Normalization : MAD calculation over a specified lookback provides dynamic scaling for momentum measurement.
Raw Impulse Detection : Price change over impulse lookback divided by MAD creates volatility-normalized momentum readings.
Threshold-Based Activation : When normalized momentum exceeds threshold (1.0), impulse registers with absolute magnitude and directional sign.
Exponential Decay Application : Between impulse events, stored impulse value decays exponentially via configurable decay rate.
Freshness Conversion : Decaying impulse transforms into freshness metric (0-100%) representing current momentum conviction.
Adaptive Band Construction : Band multiplier interpolates between minimum (fresh) and maximum (stale) settings based on freshness, then scales MAD to determine band width.
Trend State Logic : Price crossing above upper band triggers bullish state; crossing below lower band triggers bearish state; state persists until opposite breach.
Signal Generation : Trend state switches from bearish to bullish produce buy signals; bullish to bearish switches produce sell signals.
Retest Identification : Price touching inner band edge after signal buffer period marks retests, with cooldown periods preventing excessive plotting.
Together, these elements form a continuously updating trend framework anchored in momentum reality.
Interpretation
Impulse Trend Levels should be interpreted as momentum-anchored trend confidence boundaries:
Bullish Trend State (Cyan) : Established when price closes above adaptive upper band, indicating upward momentum breach with associated confidence level.
Bearish Trend State (Magenta) : Established when price closes below adaptive lower band, signaling downward momentum breach with directional conviction.
Trend Cloud : Visual gradient zone displays between outer and inner band edges, with opacity reflecting current trend state and confidence.
Band Width Dynamics : Tighter bands indicate fresh impulse (high confidence), wider bands indicate impulse decay (reduced confidence).
▲ Buy Signals : Green upward triangles mark bullish trend state initiations at crossovers above upper band.
▼ Sell Signals : Red downward triangles mark bearish trend state initiations at crossovers below lower band.
✦ Retest Markers : Small diamonds identify price retouching inner band edge after sufficient buffer period from initial signal.
Retest Extension Lines : Horizontal projections from retest points extend forward, marking potential support/resistance levels.
Colored Candles : Optional bar coloring reflects current trend state for immediate visual reference. Note: The original chart candles must be disabled in chart settings for the trend-colored candles to display properly.
Impulse freshness, band width dynamics, and momentum normalization outweigh isolated price movements.
Signal Logic & Visual Cues
Impulse Trend Levels presents two primary interaction signals:
Buy Signal (▲) : Green label appears when trend state switches from bearish to bullish via upper band crossover, suggesting momentum shift to upside.
Sell Signal (▼) : Red label displays when trend state switches from bullish to bearish via lower band crossunder, indicating momentum shift to downside.
Retest detection provides secondary confirmation when price revisits inner band boundaries after signal buffer cooldown expires.
Alert generation covers trend state switches (long/short), retest occurrences, and impulse freshness decay below 50% threshold for systematic monitoring.
Strategy Integration
Impulse Trend Levels fits within momentum-informed and adaptive trend-following approaches:
Momentum-Confirmed Entries : Use band crossovers as high-probability trend initiation points where volatility-normalized momentum exceeded threshold.
Freshness-Based Position Sizing : Scale exposure based on impulse freshness - larger positions during fresh impulse periods, reduced sizing as impulse decays.
Band-Width Risk Management : Expect wider price ranges when bands expand during decay, tighter ranges when bands contract during fresh impulse.
Retest-Based Re-entry : Use inner band retests as lower-risk entry opportunities within established trends after initial signal cooldown.
Cloud-Aligned Directional Bias : Favor trades aligning with current trend state rather than counter-trend positions.
Multi-Timeframe Momentum Confirmation : Apply higher-timeframe impulse trend state to filter lower-timeframe entry precision.
Technical Implementation Details
Core Engine : EMA-based baseline with MAD volatility measurement
Impulse Model : Volatility-normalized momentum detection with directional sign capture
Decay System : Exponential decay application (0.8-0.99 range) with freshness conversion
Band Construction : Linear interpolation between min/max multipliers scaled by MAD
Visualization : Gradient-filled cloud zones with bar coloring and signal labels
Signal Logic : State-switch detection with retest buffer and cooldown mechanisms
Performance Profile : Optimized for real-time execution across all timeframes
Optimal Application Parameters
Timeframe Guidance:
1 - 5 min : Micro-trend detection for scalping with responsive impulse settings
15 - 60 min : Intraday momentum tracking with balanced decay characteristics
4H - Daily : Swing-level trend identification with sustained impulse persistence
Suggested Baseline Configuration:
Trend Length : 19
Impulse Lookback : 5
Decay Rate : 0.99
MAD Length : 20
Band Min (Fresh) : 1.5
Band Max (Stale) : 1.9
Signal Buffer Period : 10
Show Trend Cloud : Enabled
Color Bars : Enabled (requires disabling original chart candles in chart settings)
Show Buy/Sell Signals : Enabled
These suggested parameters should be used as a baseline; their effectiveness depends on the asset's volatility profile, momentum characteristics, and preferred signal frequency, so fine-tuning is expected for optimal performance.
Parameter Calibration Notes
Use the following adjustments to refine behavior without altering the core logic:
Excessive signal noise : Increase Trend Length to demand smoother baseline crossovers or increase Impulse Lookback for less reactive momentum detection.
Missed momentum shifts : Decrease Impulse Lookback to capture shorter-term momentum changes or reduce Decay Rate to allow faster impulse fade.
Bands too tight/wide : Adjust Band Min and Band Max multipliers to modify confidence zone thickness across freshness spectrum.
Impulse decays too quickly : Increase Decay Rate toward 0.99 to sustain impulse readings longer between fresh events.
Impulse decays too slowly : Decrease Decay Rate toward 0.8 for faster momentum fade and more frequent band expansion.
Unstable volatility scaling : Increase MAD Length to smooth volatility measurement and reduce sensitivity to short-term spikes.
Too many retest markers : Increase retest cooldown period (55 bars hardcoded) or increase Signal Buffer Period to space out signals.
Adjustments should be incremental and evaluated across multiple session types rather than isolated market conditions.
Performance Characteristics
High Effectiveness:
Trending markets with clear momentum phases and directional persistence
Instruments with consistent volatility characteristics where MAD scaling normalizes effectively
Momentum continuation strategies entering on fresh impulse signals
Trend-following approaches benefiting from adaptive confidence measurement
Reduced Effectiveness:
Choppy, range-bound markets with frequent whipsaw crossovers
Extremely low volatility environments where impulse threshold becomes difficult to breach
News-driven or gapped markets with discontinuous momentum patterns
Mean-reversion dominant conditions where momentum breaches quickly reverse
Consolidation and sideways price action where trend-following methodologies inherently struggle due to lack of sustained directional movement
Integration Guidelines
Confluence : Combine with BOSWaves structure, volume analysis, or traditional trend indicators
Freshness Respect : Trust signals occurring during high impulse freshness periods with contracted bands
Decay Awareness : Reduce position sizing or tighten stops as impulse decays and bands widen
Retest Utilization : Treat inner band retests as continuation confirmation rather than reversal signals
State Discipline : Maintain directional bias aligned with current trend state until opposite band breach occurs
Disclaimer
Impulse Trend Levels is a professional-grade momentum and trend analysis tool. It uses volatility-normalized impulse detection with exponential decay modeling but does not predict future price movements. Results depend on market conditions, volatility characteristics, parameter selection, and disciplined execution. BOSWaves recommends deploying this indicator within a broader analytical framework that incorporates price structure, volume context, and comprehensive risk management.

Triple MA Alignment [odnac]
Overview
The Triple MA Alignment indicator is a powerful tool designed to visualize and analyze the alignment of three moving averages (MAs) with customizable types and lengths. It helps traders identify trends and potential reversal points by displaying the relative positions of three MAs and marking specific alignment patterns on the chart. This indicator is ideal for traders looking to understand market momentum and trend direction through moving average crossovers and alignments.
Features
Customizable Moving Average Types: Choose from Simple Moving Average (SMA), Exponential Moving Average (EMA), Smoothed Moving Average (SMMA/RMA), Weighted Moving Average (WMA), or Volume-Weighted Moving Average (VWMA).
Flexible MA Lengths: Adjust the lengths of three moving averages to suit your trading strategy (default lengths: 7, 25, 99).
Alignment Detection: Identifies six unique MA alignment patterns (A1 to A6) based on the relative positions of the three MAs.
Visual Cues: Plots MAs on the chart with distinct colors and marks alignment patterns with shapes and labels for easy interpretation.
Special Signals: Highlights specific transitions (e.g., "P" and "B" for A1, "P" and "S" for A4) to indicate potential trend changes or continuations.
How It Works
The indicator calculates three moving averages based on user-selected type and lengths. It then analyzes their relative positions to detect six possible alignment patterns:
A1 (1-2-3): MA1 > MA2 > MA3 (Strong bullish alignment)
A2 (2-1-3): MA2 > MA1 > MA3
A3 (2-3-1): MA2 > MA3 > MA1
A4 (3-2-1): MA3 > MA2 > MA1 (Strong bearish alignment)
A5 (3-1-2): MA3 > MA1 > MA2
A6 (1-3-2): MA1 > MA3 > MA2
When an alignment occurs, a shape (square, diamond, or circle) is plotted at the top or bottom of the chart, depending on the pattern. Additionally, when the alignment changes, a text label (e.g., "2", "3", "5", "6") is displayed to highlight the new pattern. Special signals ("P", "B", "S") are plotted for specific transitions to indicate potential trading opportunities.
Settings
Show Triple MA: Toggle to display or hide the three moving averages on the chart.
Show Triple MA Edge: Toggle to display or hide alignment shapes and labels.
MA Length 1, 2, 3: Set the periods for the three moving averages (default: 7, 25, 99).
MA Type: Select the moving average type (SMA, EMA, SMMA, WMA, VWMA).
Usage
Add the Indicator: Apply the indicator to your TradingView chart.
Adjust Settings: Customize MA lengths and type to match your trading style (e.g., shorter lengths for scalping, longer for swing trading).
Interpret Alignments:
A1 (Green Square): Indicates a strong bullish trend, often a signal to consider long positions.
A4 (Red Square): Indicates a strong bearish trend, often a signal to consider short positions.
A2, A3, A5, A6: Represent transitional or consolidation phases, useful for identifying potential reversals or continuations.
Special Signals (P, B, S): Watch for "P" (Pullback), "B" (Breakout), or "S" (Sell) labels for additional context.
Combine with Other Tools: Use alongside support/resistance levels, volume analysis, or other indicators for confirmation.

Simple ema and sma cross
A simple EMA and SMA cross is an indicator that uses alpha from two moving averages: SMA (simple moving average) and EMA (exponential moving average).
The point where the EMA and SMA cross is usually a good place to enter a position.
The indicator includes smoothing settings to help you find the right calibration for your trading needs.
It also marks signals with triangles for easier use and includes alerts so you never miss a cross.
